Elaam Alidor Lorville
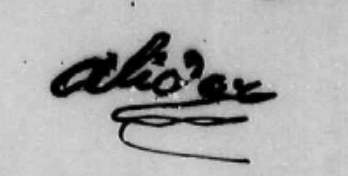

Mapping Marronage is an interactive visualization of the trans-Atlantic networks of intellectual, creative and political exchange created by enslaved people in the 18th and 19th century. It traces the geographic reach, crossings and intersections of letters, testimonies and financial exchanges by enslaved people of African-descent.
Learn how to use the visualizationsMapping Marronage is an interactive visualization of the trans-Atlantic networks of intellectual and creative exchange created by enslaved people in the 18th and 19th century. It traces the geographic reach, crossings and intersections of letters, autobiographies and creative works authored by enslaved people of African-descent. Marronage, as conceptualized in this project, is not used in the oft-evoked sense of flight from the plantation to the mountains or swamps. Instead, drawing on broader notions of flight as movement beyond the reach of slavery, this project engages with marronage writ large, the different forms of flight by which enslaved women, men and children sought to move – with varying degrees of success – beyond the reach of slavery’s oppression and dehumanization.
The "Flight" Section tracks the travels of individuals. The "Network" section tracks correspondences. There is an associated profile with the sender of the correspondence, but no profile for the recipient. Use the "Tool Tip Point" to view more information. The "Profile Drawer" opens up to reveal details about the individuals who have associated profiles in the system.

Click on “flight” section to view the mapped trajectories.
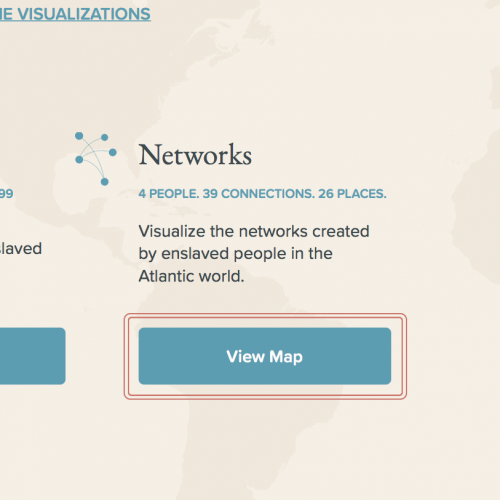
Click on “network” section to view the mapped trajectories.

Use the Horizontal Slider tool at the top left of the screen to control the date range in the visualization.
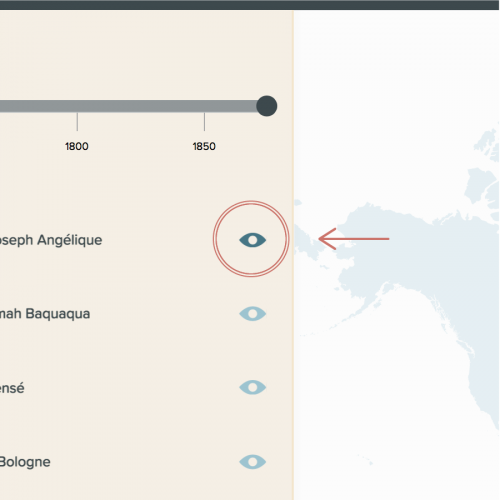
Click on the “eye” symbol to the right of the person’s name to view their trajectories on the map.
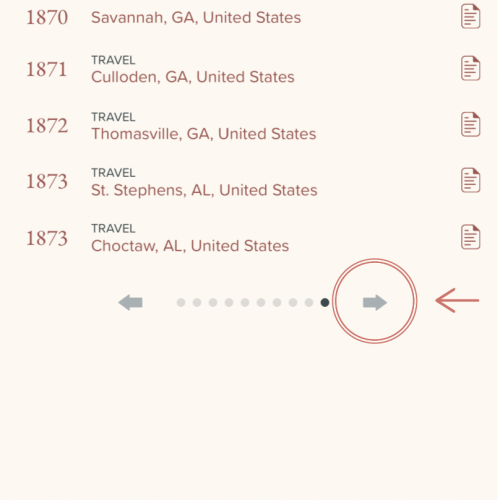
Use the arrow tool at the bottom of the profile list to scroll through the list of names.

Click on a profile name to open the profile drawer.

Use the arrow tool at the bottom of the profile drawer to scroll through the list of names.

Use the “close” button in the top right corner to hide the profile drawer.
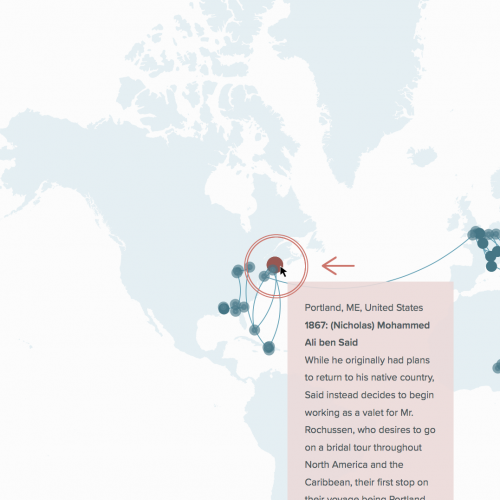
Click on any map dot to view the tool tip, and see more information about the trajectory.
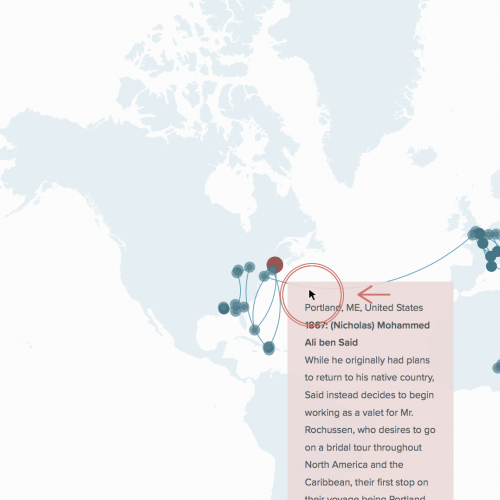
Click the tooltip to hide it again.
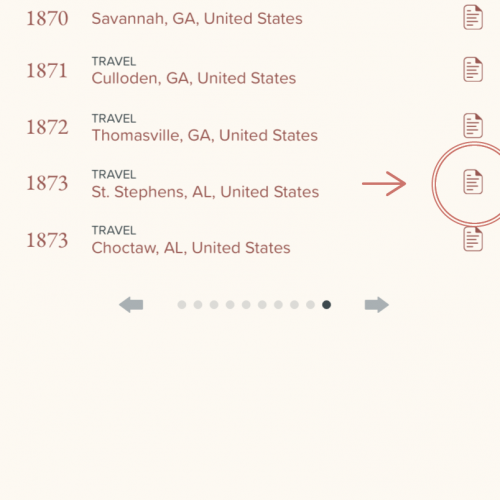
Click the page icon to view supporting documentation. This documentation may be a source image or a web link.